Sales Dashboard
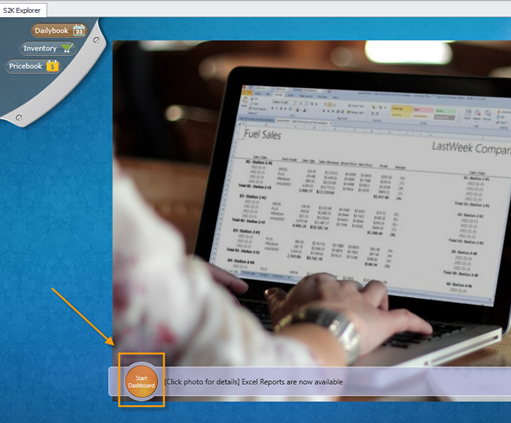
The Sales Dashboard will give you quick access to reports and charts to see how your station(s) are doing
To access the dashboard, click the Start Dashboard button from the S2K homepage
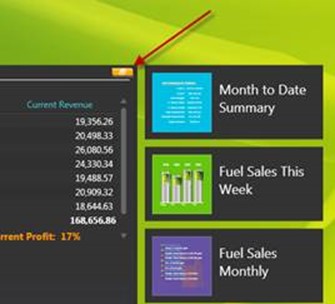
The dashboard will open for you to navigate. You can click on any of the boxes to see a more detailed report with graph
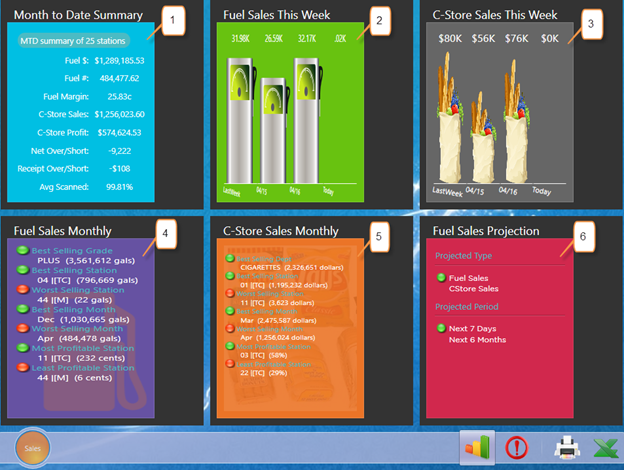
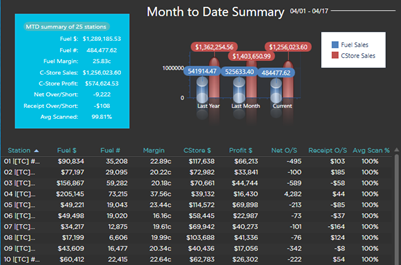
Month to Date Summary- shows sales, margin, profit, and over/short MTD
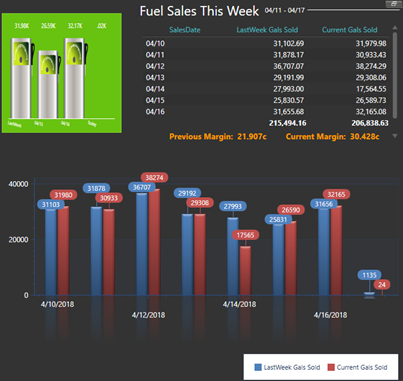
Fuel Sales This Week- Fuel Sales for the current week as compared to last week
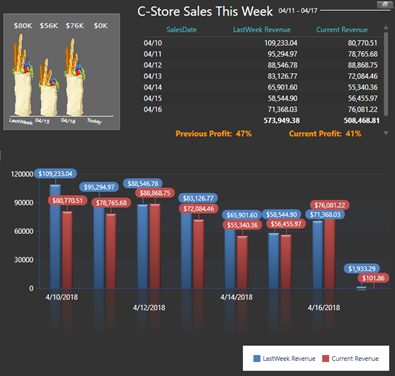
C-Store Sales This Week– C-Store Sales for the current week as compared to last week
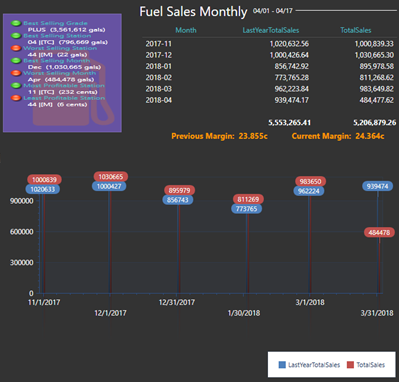
Fuel Sales Monthly– Statistics on Fuel: Best & Worst grade, station and month
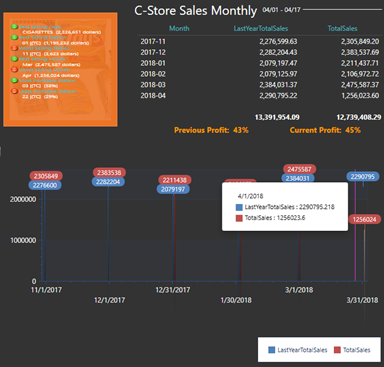
C-Store Sales Monthly– Statistics on C-Store: Best & Worst dept, station and month
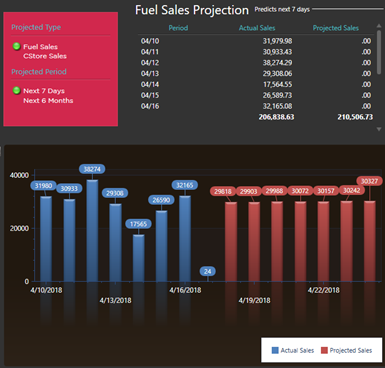
Fuel Sales Projection– Predicts next 7 days of sales for either Fuel or C-store and compares to past 7 days
To close out the graph and go back to the original screen simply click in the top right corner:
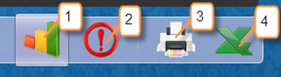
The toolbar at the bottom of the dashboard gives some additional options
-
This icon will display the sales information
-
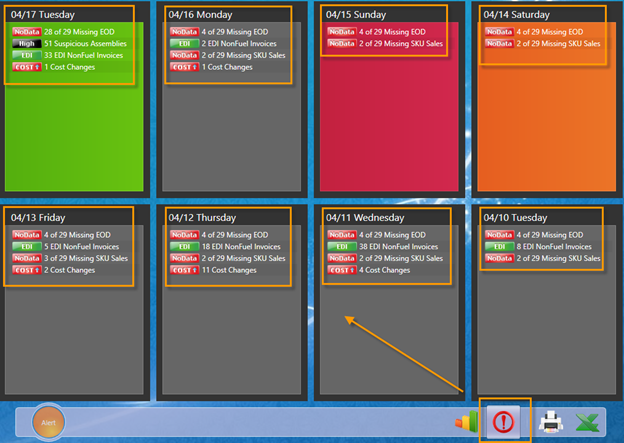
The alerts icon will update the page to show alerts for potential issues: Missing data, suspicious assemblies, EDI received, and cost changes
-
Print button
- Export to Excel button